
ZipCPU toolchain and initial test
Please accept my apologies for taking so long to put this article together. I’ve made a lot of changes to the ZipCPU in order to formally prove the components. I’ve also cleaned out all of the issues in the issue-tracker on Github. These changes have now been integrated into the baseline. They have been confirmed to build within yosys, ISE, Vivado, and Verilator. Further, the new changes have been proven on the ZBasic distribution–just not within an actual FPGA (yet). Further, when measuring the LUT usage impact of the changes that have been made, they appear to require no more than four extra LUTs–suggesting the ZipCPU remains on target to be a low-logic CPU.
Integration with FuseSoC is still now, perhaps more firmly than ever, on my to-do list.
With that aside, let’s look into how you might get started.
Introduction
Let’s spend a couple of posts discussing how to fire up the ZipCPU and run it. Our goal will be to show how the ZipCPU can be used to control a signal processing application. That, however, will take a couple of posts to get to. For this first post, let’s just discuss how to get the ZipCPU tool chain up and running, and then how to test and know that the CPU itself works.
If you look at the ZipCPU’s README file, you’ll read that the ZipCPU is only one component of a (potentially) much larger system. For example, consider the ZBasic system in the figure below.
 |
This system was designed to be a generic system that could demonstrate the ZipCPU’s capabilities. If you notice, the ZipCPU is only a small part of this full system. Likewise, the ZipSystem, a container for the ZipCPU with some peripherals connected close to the CPU, is still only a small portion of any full design. To make a full design from just a CPU, the ZBasic project also contains a serial port, a block RAM, a flash (ROM) controller, an (optional) SPI-mode SD-Card controller, and (currently) a scope for the SD-card controller as well. There are also some smaller components, such as a real-time clock, a counter-since-power up, a second interrupt controller, the date of the last time the system was built and so forth.
As with all of my designs, the ZBasic design also has a debugging bus controller that can be used to control the bus within the core from an external serial port. This version of the debugging bus controller, however, multiplexes two 7-bit channels onto an 8-bit serial port channel–unlike the one we discussed earlier. This creates a console port for the CPU, in addition to the debugging bus controller. This makes it possible to experiment with the ZBasic module on any FPGA board having only a QSPI flash and a serial port. The SDCard port is optional, and by using AutoFPGA, the block RAM can easily be resized.
Our eventual goal in this series of articles will be to show how to run this ZBasic design, while simulating all of the components, from within Verilator. As part of this goal, we’ll also add a MEMs based audio A/D and may possibly even add an SDRAM controller. We’ll even use the C-library to demonstrate a Hello World example, and possibly even to play 4x4x4 Tic-Tac-Toe.
That will be the goal of this series.
Today’s goal, however, will just be to examine the ZipCPU by itself. To do so, we’ll trace a piece ZipCPU history, and run the very first piece of software ever written for the ZipCPU.
The Initial ZipCPU Test Software
The very first piece of software I wrote for the ZipCPU just demonstrated each of the CPU’s instructions, and its ability to execute them.
The initial version of this test was created by a test generator piece of software that at one time wrote a couple of machine code instructions into a binary file which would then describe the block RAM memory image for the CPU. I was so excited to get this simple code to work! Little did I know how much more work would be involved in finding all the corner cases within any CPU. This piece of code, however, is now only relic-ware. Indeed, it is not only a couple of instruction set architecture versions out of date, but since it was causing build errors for users it has since been removed from the repository entirely.
With the introduction of the first ZipCPU assembler, the program that generated machine code was replaced with an assembly file. Even though that initial assembler has now also become relic-ware, the assembly file test has been maintained to the point that it can still be assembled using the ZipCPU version of binutils. Unlike the original assembler, binutils provides several valuable capabilities–such as the ability to link multiple files together, the ability to follow a script describing where memory and/or flash are located, the ability to place an initial RAM image in flash, and even the ability to integrate with GCC.
This remaining piece of software/testware starts with a branch-always followed by break test–just to make certain the pipeline works. It then continues by testing some basic register setting commands. It was meant to be run within a monitor program. Using this program, you can step through this software one clock cycle at a time–just like we discussed earlier.
Let’s build and run this program today, to give us some confidence that the CPU itself continues to work.
Building the tools
The first step in converting any assembly file into machine code is to acquire (or build) an assembler and linker. The ZipCPU has backend support for binutils (assembler and linker), the GCC C-compiler, and newlib. Although only binutils is required for this testing program, all of the tools are built from the same command, so let’s build them together.
To build the ZipCPU tool-suite, first make sure you have the prerequisites for GCC. For debian based systems, this will look like:
sudo apt install flex bison libbison-dev libgmp-dev libmpfr-dev libmpc-dev bc
sudo apt install texinfo
You’ll notice several *-dev components. These are different from their non
-dev counterparts, in that they allow you to build components using these
libraries rather than just using binary components already built. In other
words, installing gmp isn’t good enough, you’ll need to install libgmp-dev.
You are also going to need Verilator to translate the ZipCPU’s Verilog source code into the C++ necessary to simulate it,
sudo apt install verilatorThe simulation driver needs libelf in order to know where to load programs and program components into memory,
sudo apt install libelf-devPlease note that, as with the earlier components, this package is the development version of libelf. We’ll need that version to build a program that uses it that can read and process an ELF file.
Many of my distributions depend upon ctags, and the simulation control program is written using ncurses, so let’s get those as well:
sudo apt install ncurses-dev ctagsIf you are using Windows, these instructions should get you started using these tools via cygwin. Since I’m not using Windows regularly, please let me know if you have any problems building with cygwin–I’ll probably never notice the problem otherwise.
One you have these prerequisites, it is now time to actually clone the ZipCPU repository,
git clone --depth 1 https://github.com/ZipCPU/zipcpu
cd zipcpu
While you may have cloned repositories without the depth command, doing so
with the
ZipCPU
repository will also download a history
containing several versions of GCC. In other words,
you’ll be spending a lot of bandwidth downloading more of the
repository than you need.
At this point, you should be able to just type “make”.
makeThis will orchestrate a Verilator-based make of the “rtl/” directory, and a build of the simulation directory, “sim/verilator”. It will also trigger a build of the ZipCPU tool-suite that we’ll need to turn the simulation test file from assembly into object code.
The current version of the tools will be built and placed into a “sw/install” directory within the cloned repository of the ZipCPU. Before going further, you will need to make certain that this directory is a part of your path.
export PATH=$PATH:<your-path-to-zipcpu>/sw/install/cross-tools/binI am very interested in any struggles you may have during this process. Please create an issue on GitHub if you have any errors up to this point.
Running the test file
Now that you have the tool suite, and now that your PATH environment
variable has been modified so that zip-as and zip-cpp are in
your path, then it is now time to build the simulation test
file.
For this, we’ll change into the
bench/asm,
and run make simtest.
cd bench/asm
make simtest
You can also build a disassembly file of the result, in case you are ever interested in what the original instructions actually build into, by
make simtest.txtOnce built, we can change into the Verilator based simulation directory,
cd ../..
cd sim/verilator
From here, you can run the automated tests. There are two such tests, both based off of the same simulated test instructions.
The first automated test just runs the test file, using the ZipCPU’s debug interface and particularly the step instruction provided by that interface–the same step control that the CPU would use were it placed on actual hardware.
./zipsys_tb -s ../../bench/asm/simtestTo know when the test is complete, the test file has been designed to “end” in one of two states. It will either end with 1) a halt instruction (successful exit), or 2) a BUSY instruction (error exit). The simulator will detect this interface, and return an appropriate value to the shell.
The second automated test simulates how the CPU would run if it were actually running on the device without the debugging interface.
./zipsys_tb -a ../../bench/asm/simtestThese two tests are so valuable to me, that I have a make target set up just to run both of them,
make testThere’s a third way to run the test as well–the interactive test. Although starting the run is just as simple,
make itestthere are more details involved in commanding it, which we’ll get into in the next section.
Further, no matter how you run this simulator, it will (currently) always create a VCD trace file. You are welcome to open this file in a waveform viewer to see the internal signals within the ZipCPU if you would like. This isn’t true of the ZipCPU simulator within the ZBasic repository–since the trace files for that simulator can easily grow to many Gigabytes in length, that one is turned off by default. In this case, though, the simtest file is short enough that the VCD trace file should remain within a reasonable size.
Interactive Commands
Now that you know how to start the simulation based debugger let’s spend some time describing how to work operate it. As you’ll recall from the last section, starting the ZipCPU simulation based debugger is easy. Just run
make itestfrom the “sim/verilated” subdirectory.
This will apply the simulation to the simtest file. To start it with another file you can run,
./zipsys_tb <your-executable-file>Knowing what to do next isn’t quite as simple. Sure, either hitting the escape key or ‘q’ will exit, but you can do a lot more. Here’s a cheat sheet so you’ll know what to do. Specifically, the ZipCPU simulator understands the following command keys:
- ‘h’ Halts the CPU
- ‘g’ tells the CPU to go until given another command.
- ‘G’ does the same thing, but only updates the screen any time a user types a character. It’s useful for moving quickly through a long simulation if necessary.
- ‘r’ gives the CPU the reset command, sending it back to supervisor mode and the reset address
- ’s’ steps the CPU using the debugging interface that will exist within the FPGA implementation
- ‘t’ ticks the clock. It steps the Verilator simulation by one clock tick, but done in such a fashion that the CPU’s Verilog logic doesn’t know it’s being stepped.
- ‘T’ releases the CPU from the hardware debugging mode. This is useful if you’ve been giving it the step command (separate from ticking the clock), and you want the CPU to continue without being given explicit step instructions.
- ‘q’ quits the simulation
- Ctrl-L redraws the screen. This used to be really important when running a curses program over a modem connection–any time someone else in the house would pick up the phone, you’d get a bunch of garbage on the screen and your computer would need to re-sync. While it’s not as necessary today, I did find it necessary to add this capability in–specifically for the case where I have GTKWave running in the background spewing warnings over my screen anytime I update the display.
- ‘u’ switches the performance times to show user mode performance
- ‘m’ switches the performance times to show global machine performance
If this is your first experience with the simulator, just remember three characters: ‘t’ steps it forward, ‘r’ restarts it, and ‘q’ exits. You might just wish to press ‘t’ several times and watch what happens. If that gets boring, try typing ‘g’–you can stop the ZipCPU anytime by typing ‘t’ later to return to single-clock-tick mode.
The simulator also has the ability to adjust and change registers. You can move around the display using the arrow keys. When you get to a register you wish to adjust, press the enter key, type the new number, and then press enter (to set the value) or escape (to leave the mode).
Understanding the Interactive Display
So let’s look at what this interface tells us.
When you initially start the simulator, you’ll see a screen looking like Fig 2 below.
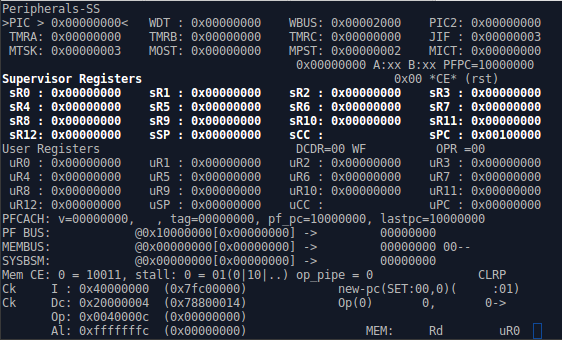 |
Let’s break down the components of this view, so that you can understand what’s going on. Fig 3. therefore shows the basic sections of the simulation screen.
 |
Starting at the top are two lines describing the ZipSystem peripherals. These peripherals are shown in the blue box of Fig 1 above, they consist of an interrupt controller (PIC), a watchdog timer (WDT), a bus watchdog (WBUS), and the second interrupt control register (PIC2). Judging from these peripherals, you can tell if (for example) interrupts are enabled, or an interrupt is pending. On the next line are the three count-down timers (TMRA-TMRC), and a Jiffies peripheral for controlling absolute rather than relative programmable interrupt timing. (This would be useful for real-time task scheduling.)
The next line, starting with MTSK, shows the values of four
performance counters. The first counts the number clock ticks, and the last counts
the number of instructions retired. The two in the middle count how often the
operands stage of the
pipeline is stalled,
and how often the
prefetch
is stalled. These are global counters. They count whether the
CPU
is in supervisor mode or user
mode. There’s a
second set of identical
counters,
revealed by typing u within the
simulation,
showing the same basic values–but this second set only increments
while in user mode. This makes it possible to measure per user-task statistics.
Further information regarding these peripherals, and the performance counters may be found within the ZipCPU reference manual.
The third section of the display in Fig 3 is the CPU register section. As you may recall, the ZipCPU has two sets of sixteen 32-bit registers. These are shown in this section. The registers range from R0 to R12, and then the stack pointer (SP), condition codes register (CC), and program counter (PC). The supervisor set is shown on top, the user set underneath. The set that is highlighted indicates which mode the CPU is currently in–in this case, the CPU is in supervisor mode.
The fourth section, coming down from the top, tells you about the bus.
The PF BUS line gives you information about the
prefetch
unit, and the MEMBUS line tells you about the memory module. The third line
shows the result of the output of the
arbiter,
and which of these units actually has access to the bus.
The final section shows the instruction
pipeline. As you may
remember, the
ZipCPU
has a basic five stage pipeline. The bottom of the display shows only four
lines. These are the output of the
prefetch (I), the
output of the instruction
decoder
(Dc), the output of the read operands section (Op) and the result of the
ALU (Al).
Indeed, this section is so important for understanding how the CPU works, that we should take a deeper look at it. If you hold and press the ‘t’ key for a while, you’ll come across the state shown in Fig 4 below.
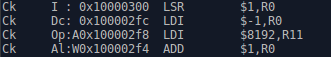 |
The first two columns on the left will show Ck to indicate that the pipeline
stage’s CE line is high, or Stl, to show that the particular stage is
stalled. Most instructions will be followed by a :, although the first
half of any compressed instruction will be followed by a /. Following
the decode stage, either an A (ALU), M (memory), or I (illegal)
character may follow the ; (or /). Immediately after this (optional)
character, is the address the instruction was read from.
If an instruction follows, as with all of the stages in Fig 4
above, then the particular
pipeline
stage has valid values within it.
If the instruction is highlighted, its being run in supervisor mode.
These instructions, therefore, are being run from user mode.
Is this making any sense? Perhaps you might then be interested in the homework section that follows.
Interactive Homework
One of the really fun parts of
this simulation.
is watching how the performance
of the CPU
is impacted by how well the
prefetch
mechanism works. This is primarily controlled by some defines within the
cpudefs.v file.
Since you’ve already looked at how the
CPU
operates in its default configuration with a
prefetch and cache
enabled,
let’s see how it does with some other
prefetch
module’s enabled. Hence, for a second test, let’s uncomment the
OPT_DOUBLE_FETCH define within
cpudefs.v,
define OPT_DOUBLE_FETCHYou will then need to re-run make in the “rtl/” directory, as well as the “sim/verilated” directory.
This will switch the CPU from using the prefetch and I-cache of the pfcache module, to using a module that fetches two instructions at a time: dblfetch. dblfetch was designed to be a simpler prefetch than the pfcache module, but also to have better performance than the single instruction at a time prefetch module–especially when reading instructions from flash.
Speaking of the
single prefetch
module, why don’t we give that one a try?
To see how the
CPU
performs with a
prefetch
module that only retrieves one instruction at a time, go ahead and uncomment
the OPT_SINGLE_FETCH line from within
cpudefs.v,
define OPT_SINGLE_FETCHand then rerun make in the “rtl/” directory, and “sim/verilated” directories again.
See the difference?
With the prefetch + cache, the
CPU
has to pause any time the
cache
line needs to be re-filled. This is particularly pronounced at the beginning
of the
simulation
where you have to wait many clocks for the
CPU
to fill the
cache.
You may also notice the effects of
this prefetch
any time the
CPU
hits a
branch instruction, whether a
branch always BRA
or a conditional branch
(nominally a conditional ADD
instruction)–the
two will have different effects within the
simulator.
The
branch always
instruction will suffer a single stall, and then (appear to) replace the
branch instruction moving through the
pipeline with the
instruction prior to the
branch
target. This is primarily an effect within the
simulator viewer,
the
CPU
doesn’t actually execute this other instruction, but it does send the
branch’s
target address through the
pipeline–leading to
the misleading view. The
conditional branch,
on the other hand, will clear the
pipeline
anytime it is taken. If the result is in the
cache,
then the new instructions will start filling the (now empty)
pipeline
following the branch.
On the other hand, with the single prefetch module, the CPU is unable to fill its pipeline. It seems to be forever fetching the next instruction, while spending very little time actually executing instructions.
When I first saw this difference, I suddenly learned a lot about how important the cache is to CPU performance. It was for this purpose that I wanted to share this demonstration with you–I just found it very valuable.
Next Time
Our next step, now that you’ve built the ZipCPU toolchain, will be to run the CPU test program program from within the ZBasic repository. This goes beyond testing just the CPU–it involves testing a simulated flash and a simulated serial port–together with their controllers. If time permits, I’ll even add the instructions to play 4x4x4 tic-tac-toe within that demonstration–it’s a fun game and a nice way to relieve the stress of getting something new working.
Beyond that, I’ve still got a couple of blogging articles planned along this line. The next article I have planned will show how to add a microphone controller component to wishbone bus within the ZBasic implementation using AutoFPGA. I’d also like to show how you can profile a CPU running Dhrystone within a simulator, using a capability similar to the ZipCPU’s pdump program. This was also very instructive to me, since it helped me understand where and when the CPU ended up stalling, and what it would stall for under a reasonable load.
So, stick around, there’s more coming!
Shall the axe boast itself against him that heweth therewith? or shall the saw magnify itself against him that shaketh it? as if the rod should shake itself against them that lift it up, or as if the staff should lift up itself, as if it were no wood. (Isaiah 10:15)