Frequency Resolution (Teaser)
When estimating frequency, the uncertainty principle creates a well known limit on the bounds of what can be done.
What’s not so apparent is how far frequency resolution can be pushed, without violating the uncertainty principle.
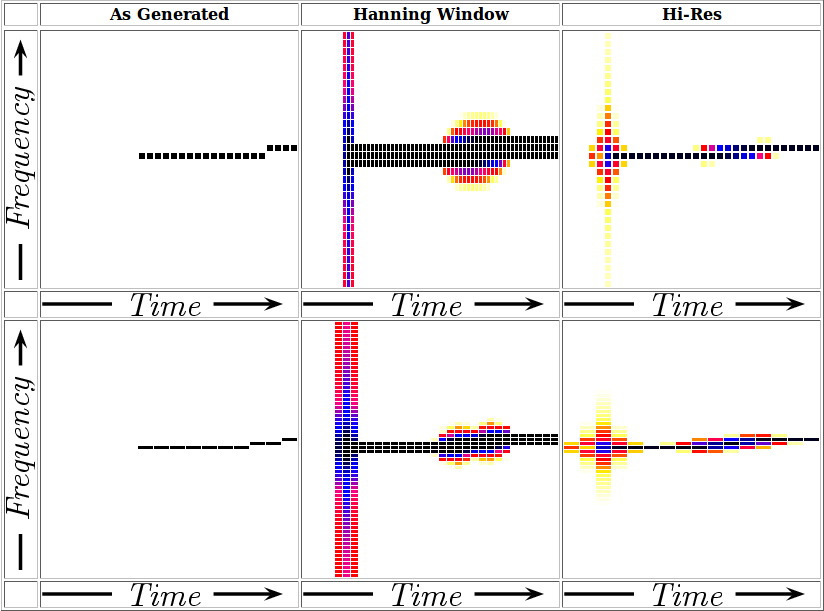
Consider as an example the spectrogram of a swept tone. Such a swept tone would have an instantaneous start. Further, as the tone sweeps from one frequency to the next, an “ideal” (unimplementable) filter would suddenly switch from bin to bin as it walked across frequency, as shown below under “As Generated”.

Other windows can be used to analyze this test signal. One common window is the Hann window. This window, however, blurs the results across frequency. If you could use a higher resolution window, though, you could then watch as the swept tone gradually moved from one frequency bin to the next.
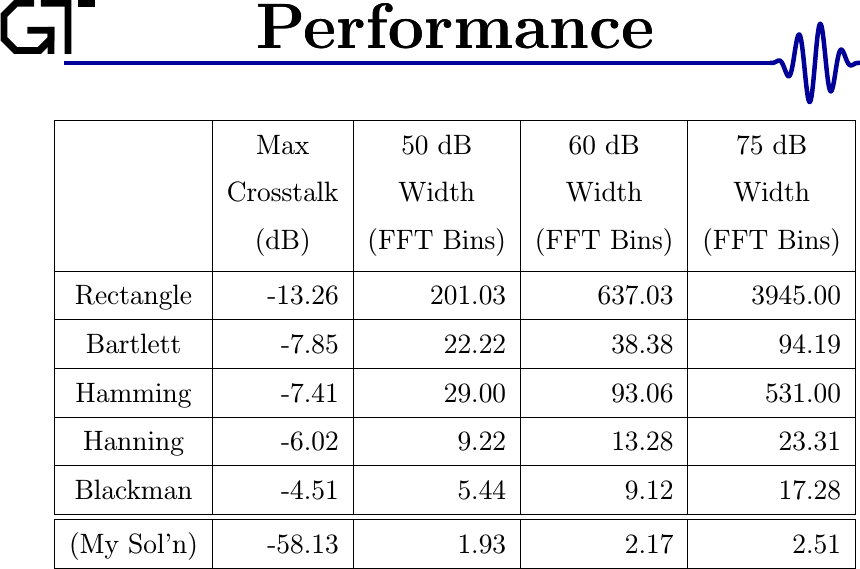
The chart below shows this same effect, but in numbers. It measures the width of several various filters some number of Decibels below the maximum.

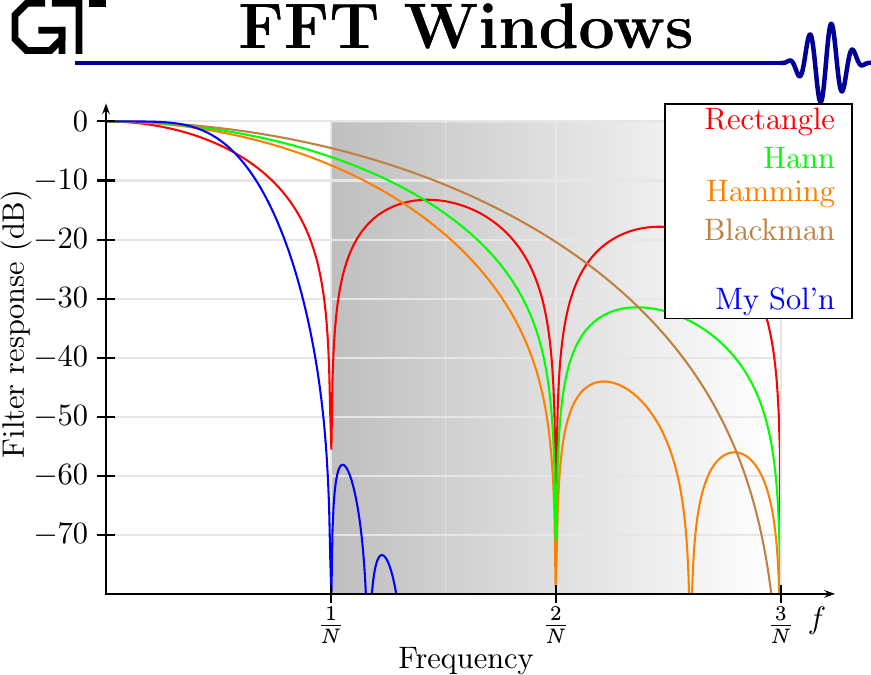
Do I have your interest yet? Here’s a chart of the frequency response of several window functions. Which of these does the better job rejecting out-of-band interference?

I’m hoping to pursue this topic to work up to how to perform the operation necessary to achieve this frequency resolution. This is going to include:
-
An outline of the criteria for valid spectral analysis. (Foreshadow: the Wigner Distribution Function violates these criteria.)
-
A discussion outlining the criteria of a useful Energy Spectral Density function. This discussion will specifically focus on the conservation of energy, and how to achieve it.
-
A proof of showing that one spectral analysis method outperforms all others when it comes to achieving the minimum uncertainty.
-
A discussion developing how individual channels in this transform can be visualized
-
A description of how the FFT can be used to speed up the transform
-
A description of how the transform can be inverted
