
Why you want a debug port into your FPGA
Using the tools within the dbgbus project, I was able to create the following scope output.
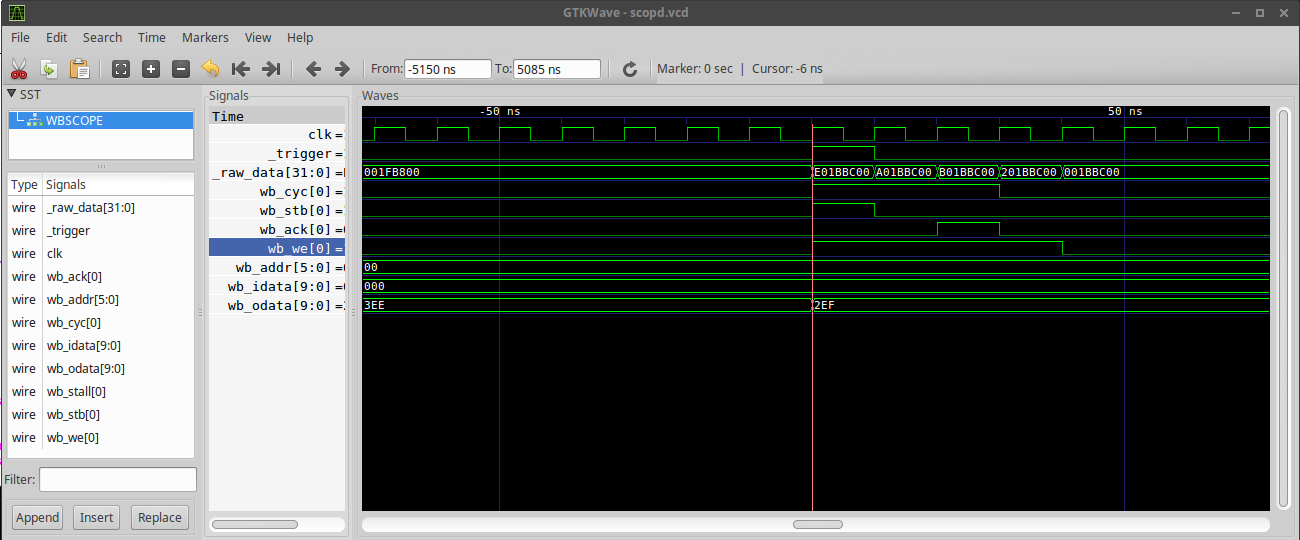 |
What’s keeping you from wanting to use an open source capability like this?
-
Are you trying to figure out how to deal with a flash memory, with an uncertain specification that you are struggling to understand? [1]
If you use an integrated scope, such as the wishbone scope this project uses, you’ll be able to examine not only whether or not your code is producing the correct output values, as well as seeing what the response is from the device.
-
Or is your problem trying to get an FFT to work? Are you struggling to “know” what data is going into the FFT and what data is coming out? [2] [3]
You could use this approach to grab a copy of the data coming out of the XADC, as well as data coming out of the FFT, and then see where your problem is (if any).
-
Are you hoping to connect your Basys3 board to an Arduino, and can’t figure out why your design isn’t working? [4]
Wouldn’t it help to see what your logic is doing internally? That’s the purpose of this debugging bus and connected wishbone scope.
-
Do you want to know what button bouncing looks like? How long a button bounces before settling? [5]
If your button processing code isn’t working, a wishbone scope connected to a debugging bus would show you why a simple button push isn’t simply incrementing a counter like you might like. You could see what’s going on for yourself.
-
Struggling to debug why an FIR filter is or isn’t working? [6] Do you know if your FPGA code works? You can use this scope to find out.
We’ll be discussing within this blog how to go about debugging digital signal processing using these tools as well.
Once the software interface to this debugging bus is added into the design, you’ll be able to do any of the above.
John to the seven churches which are in Asia: Grace be unto you, and peace, from him which is, and which was, and which is to come; and from the seven Spirits which are before his throne (Rev 1:4)