
How to build a simulation based debugger for your own soft-core CPU
So you want to build a soft-core CPU?
Have you given any thought to how you will test that CPU, or how you will debug the programs you are running within it?
If you know my debugging philosophy, you’ll also know that I am a firm believer in simulation. I like to use not only Verilator for simulating my cores, but also printf() and GTKWave for examining the results as I’ve discussed here.
Somehow, as with DSP debugging, these two approaches are insufficient when it comes to debugging a soft-core CPU. Another approach is needed.
Therefore, this article will present a simpler approach to debugging a CPU when using Verilator. Sure, it will take a bit more work to set up, but I think you’ll find the result well worth the effort when it comes time to debug your own CPU.
Debugger Overview
You may remember from our discussion of CPU debuggers what the requirements of a debugger in simulation are, shown in Fig 1.
 |
Today, we’ll be focusing our efforts on building the interaction in the simulation column.
What makes building a CPU debugger different from any other Verilator based simulation test harness, is the requirement that you may wish to examine the CPU state after every clock tick. It is this examination that will be the primary focus of the discussion today. Along the way, we’ll show how to step the CPU by a single clock tick, as well as how to generate trace information. Stopping on a break point, though, will require a handshake between your simulation and your CPU.
 |
We’ll start with the code that we’ve written and discussed for simulating an FPGA design while also simulating multiple peripherals. We illustrated this concept before using Fig 2. If you haven’t already built a simple test harness for your FPGA design, you’ll want to put that functionality together before we start. You don’t have to make it work yet. Building a Verilator based CPU debugger will require some other modifications before getting there.
Then, to that basic test harness, we’ll add an ncurses display functionality, as outlined in Fig 3. below. In this case, we’ll break up the Verilator test harness while loop, and add an ncurses interface to it in order to achieve a debugging capability.
 |
If you’ve never used the ncurses library before, it’s really not all that hard, and it really simplifies building a textual debugger.
Loading your program
The ncurses library library is very much about textual screen manipulation. We’ll use that to place register values on the screen, and to accept user input to control the simulation.
However, before any screen manipulation, you’ll want to process any command line arguments to your test harness program. This includes finding and loading any initial memory, whether into your flash or SDRAM simulator or other.
In particular, if there’s any reason why your test program would need to end on an error, it helps to find and handle those errors before starting the ncurses, environment. Once ncurses, starts, we’ll need to be careful to make sure that your program only exits by way of the ncurses endwin, function before calling exit.
Starting and stopping ncurses
Once you are sure your test harness is ready to fire up your design, then it’s time to start the ncurses screen environment. Starting up ncurses involves calling four basic functions:
#include <stdio.h>
#include <ncurses.h>

int main(...) {
	// Process arguments
	...
	// Initialize ncurses
	initscr();
	raw();
	noecho();
	keypad(stdscr, true);
	//
	...
}
The first of these functions, initscr(), just initializes ncurses and starts up the display.
The raw() function tells ncurses that we don’t want any input buffering. This will become important later, as we’d like to be able to step the CPU one clock at a time on a keypress, and we don’t want to have to wait for a return key along the way.
If you want to be able to just hit a key and step the CPU, then you aren’t really going to want that key displayed to the screen. That’s the purpose of the noecho() function call.
Finally, the keypad(stdscr, true) command requests that all special characters (function keys, arrows, etc), be sent to our processing loop just like everything else.
The other part of the basic ncurses setup is stopping your simulation. Once you finally get to the end of your debugging and simulation session, then you are going to want to call endwin to return your screen to normal, like it was before you started your simulator.
endwin();If you get in trouble, you may find that typing
stty sanehelps. Modern terminals often have a reset terminal button that cna help as well.
That’s the basics of getting ncurses started, now let’s see if we can’t turn around and use it to help us simulate this design.
The Verilator Loop
Remember the previous Verilator test harness loop function, we built? It looked something like:
int main(...) {
	// ...
	while(!done()) {
		tb->tick();
	}
	// ...
}
As you may recall from the Verilator article, this function then called a testbench method which toggled our clock and provided any peripheral inputs:
class CPU_TB {
	// ...
	void tick(void) {
		m_tickcount++;

		// ... Handle peripheral inputs

		// Allow combinatorial logic to settle before toggling the
		// clock
		m_core->i_clk = 0;
		m_core->eval();
		if (m_trace) m_trace->dump(10*m_tickcount -2);

		// Simulate the positive edge of the clock
		m_core->i_clk = 1;
		m_core->eval();
		if (m_trace) m_trace->dump(10*m_tickcount);

		// Simulate the negative edge of the clock
		m_core->i_clk = 0;
		m_core->eval();
		if (m_trace) {
			m_trace->dump(10*m_tickcount+5);
			m_trace->flush();
		}
		// ... Handle any debugging output requirements
	}
	// ...
}
This is going to be the first thing we’ll need to change.
Specifically, we’re going to rebuild the inner loop portion of main function.
The new inner loop is going to read a user keypress, and then its going to
process that keypress as you would like. For demonstration purposes, we’ll
set this up so that:
-
If the user types a control-L, the screen will redraw itself
-
If the user types an ‘r’, the CPU will restart
-
If he types a ‘q’, we’ll quit.
-
Finally, if the user types a
t, and only then, will we actually step the CPU by one clock only.
#define	CTRL(X)	((X)&0x01f)
...
while(!done) {
	// Get a user command
	chv = getch();

	// Process the user's command
	switch(tolower(chv)) {
	// Place any user keyboard commands you'd like here.
	...
	// Some I use include:
	case CTRL('L'): // Redraw the screen on control-L
		redrawwin(stdscr);
	case 'q': // Reset the CPU
		done = false;
		break;
	case 'r': // Reset the CPU
		tb->reset();
		break;
	case 't': // Tick the CPU by one clock tick
		// tb->tick() toggles our clock,
		// and sends CPU values to a trace file
		tb->tick();
		break;
	default:
		// Either no keypress was available, or the
		// user hit an accidental keypress.
		//
		// In either case: do nothing
	}

	tb->show_cpu_state();
}
The code above presents a couple of new functions. These include two new ncurses commands, getch() and redrawwin(stdscr). They also include some methods to add to our testbench.
The first of these, getch(), simply returns a character from the terminal. This function also hides a beginner bug. Normally, after any change to the screen, ncurses will require you to call refresh() to update the screen. The reality of ncurses is that none of the functions that write to the screen actually send any output to the screen until refresh() is called. Hence, if you aren’t familiar with ncurses, you might get frustrated when nothing gets written to your screen. getch() helps us avoid this error, by quietly calling refresh() for us anytime we call getch().
The other command, redrawwin(stdscr), repaints the screen from scratch. It’s not normally necessary, but if some other program has written to your screen you will enjoy the ability to refresh what’s on it. Ctrl-L seems to be a common key among other programs for this purpose, so we continue that capability here.
You can also get creative in this main loop. For example, if you know that
your CPU will have a problem N clocks after reboot, you can run a simple
for loop before entering this main while loop in order to skip those
N clocks before starting your debugging session.
//...
for(unsigned k=0; k<STARTUP_TICKS; k++)
	tb->tick();
while(!done) {
	// ...
}
For example, you might wish to skip the bootloader that copies data from flash to memory, so you can debug your actual program.
All in all, though, this while loop handles the logic necessary to step and reset the CPU, as well as the logic necessary to quit the simulation from the standpoint of the main loop. The big capability we are missing at this point is how to implement these new testbench methods.
The Testbench Class
So let’s look at the test bench methods that will need to change. From the
source above, we needed three functions: reset(), show_cpu_state(), as
well as the tick() function that we’ve already discussed.
Of these three functions, reset(), is the simplest to implement–assuming
your CPU has an input for a synchronous reset:
void CPU_TB::reset(void) {
	m_core->i_reset = 1;
	tick();
	m_core->i_reset = 0;
}
Showing the CPU’s state will take a bit more work. The first step is to
find the variables and registers within
Verilator’s
variable set. To do this, I usually browse the *.h file found within the
Verilator
output directory. (This defaults to obj_dir/). In the case of the
ZipCPU, the register set
can be found in
Verilator’s
v__DOT__thecpu__DOT__regset variable. If you aren’t familiar with
Verilator’s
naming scheme, this is the name
Verilator
gives to the regset array found
within the thecpu module found at the top level. Be aware that
Verilator
has recently changed its naming schemes, so you may have to look a bit.
Now that I know where to find my register array, I can copy it to a local variable where I can then use it:
CPU_TB::read_state_from_cpu(void) {
	memcpy(m_state.r, m_core->v__DOT__thecpu__DOT__regset,
		NREGS * sizeof(v__DOT__thecpu__DOT__regset[0]));
}
Now that we know what our register values are, it’s time to place them onto the screen. The easiest way to do this is with the mvprintw() ncurses command. This command combines screen movement with a printf-like interface. Hence, we can write the values of all our registers to the screen, as in:
CPU_TB::show_cpu_state(void) {
	read_state_from_cpu();

	for(int i=0; i<16; i++) {
		mvprintw((i/4),20*(i&3), "R%2d: 0x%08x", m_state.r[i]);
}
Don’t get surprised: the coordinates are not in x, y order, but rather
y, x order.
You can also get as fancy as you want in this step. For example, I like to look up the instruction memory at the program counter, and disassemble the instructions in the CPU pipeline.
In my case, it has gotten so that every time I need to debug a register within the ZipCPU, I tend to just add another mvprintw() function call to my CPU-state display, so I can see how that new line is being adjusted as the CPU runs. The result looks something like Fig 4 below.
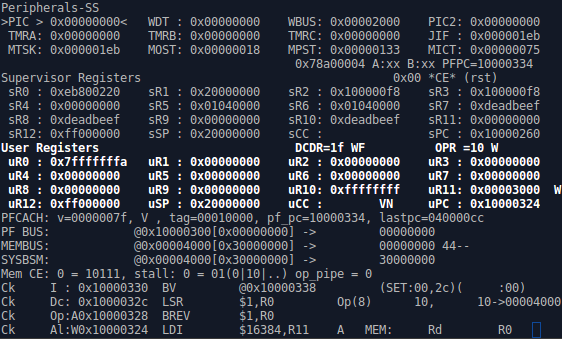 |
Indeed, I have not only register sets and disassembled instruction words,
but also bus debugging information (PFCACH, PF BUS, MEMBUS, SYSBSM,
etc), and pipeline stall information (see the Ck at the far left).
That’s just about it: you’ve now made all of the modifications you need to make to turn your Verilator test harness into a usable CPU debugger.
Compiling with ncurses
Getting this test bench to compile shouldn’t be any more difficult than
getting any
Verilator
based test bench to compile, but with one significant
difference: You’ll need to add -lncurses to your final compile to make
sure that the
ncurses
library gets included.
The big drawback to an ncurses based display
Having used a debugger of this form for a couple of years now, I find there is one significant drawback to it: once you type ‘t’ and cause the simulator to ‘tick’ the clock and step the processor forward by a single clock tick, there’s no going back to look at the previous state.
While I’ve dreamed of implementing a ‘back’ key, my current approach is to do any further debugging with printf() and GTKWave.
The problem with printf() based debugging at this point, though, is that the screen is already being used. While I suppose you could pipe the output of an ncurses based program into a file, the screen control keys that ncurses uses are likely going to keep it from being very legible.
I get around this problem by adding some debugging functions to the tick()
method. Specifically, between every positive clock edge and the next,
I will dump any debugging information such as the program counter or register
set, to a debugging file so that I can look back later and understand
what just took place.
CPU_TB::tick(void) {
	// ...
	// Provide any simulated inputs to your core here.
	// ...

	// Tick the clock
	// ...

	// Take a moment to write things to a debugging file, for after
	// action tracing.  I just use fprintf's here.
	if (m_dbgfp) {
		fprintf(m_dbgfp, "Some useful information\n");
	}
}
Other things you can do
If you haven’t figured it out yet, the moral of all of this story is that Verilator turns an FPGA debugging and development session into any other C++ program. You can add functionality to this program just like you would any other.
For example, here are some additional functions that you may find very useful:
-
Creating commands to simulate debugging the CPU via your chosen hardware debugging interface.
On the ZipCPU, the step command is implemented this way. Typing an ‘s’ will “step” the CPU by one instruction, using the same interface that will be needed to control the CPU for debugging later.
-
A “Go” until breakpoint command
Perhaps I should describe how to use the ZipCPU debugging simulator as an example of this lesson? It’s actually really fun to watch, since you can see what happens on each pipeline step, when instructions need to stall, or even how the pipeline fills behind a stalled instruction.
Let me know what you think!
In the morning sow thy seed, and in the evening withhold not thine hand: for thou knowest not whether shall prosper, either this or that, or whether they both shall be alike good. (Eccl 11:6)