
Design Needs when Debugging a SoftCore CPU
Building your own soft core CPU within an FPGA can be a tremendous learning experience. Doing so will provide you with an in-depth insight into how a CPU works that may be difficult to come by otherwise.
As you consider the requirements of the CPU you would like to build, let me also recommend that you consider what it will take to debug your CPU early on. It might keep you from rebuilding parts and pieces of your CPU later.
Sure, there’s component testing to make sure the components of the CPU work, but what will it take to actually debug the CPU–in both hardware and software?
Let’s look at this from two different standpoints. First, what do you need to debug a CPU in general, and specifically what operations will your debugger need to be able to perform. Second, what are the different contexts that you will need in order to debug your CPU?
Debugging needs
If you’ve ever used a debugger, the debugger typically offers you several things you can do with your program.
-
Reboot: You can start or restart the program. On an embedded CPU that doesn’t support multiple independent programs, this may mean issuing a command to reboot CPU.
-
Step: The CPU will then either start, or start in a stopped state. While in this stopped state, you should be able to step your CPU forward through its instructions.
This often means something different depending upon context.
-
Stop on Breakpoint: Stepping through a long list of instructions, such as a bootloader loading a program from ROM into RAM, before you get to the logic you actually want to debug can be a real drag. For this reason, debuggers offer the capability to set and clear breakpoints within your CPU.
The idea is basically this: once a breakpoint is set, the CPU can be let loose to run. When the CPU hits the breakpoint, it will halt and bring up the debugger for you to examine where it is at.
-
Examine CPU State: Any time the CPU, or the program the CPU is running, is stopped, the user should then be able to examine the CPU’s state. This may mean examining the registers of a register based CPU, or the stack of a stack based CPU—perhaps even both.
For example, on the ZipCPU, the assembly level debugger brings up a view of all 32 ZipCPU registers, and the current instruction sequence (See Figs 1 or 2 below). One of the two debugging views (Fig 2) also shows a couple variables on the top of the stack as well.
When evaluating the CPU within simulation, you’ll also want to see internal variables that aren’t typically considered an “official” part of the CPU state, but yet form a part of the state that you need in order to debug it.
-
Continue: If you’ve stopped the CPU, you’ll also want the ability to restart it after you’ve examined what is going on within the CPU.
-
Trace: This isn’t normally a considered a debugger capability, and probably won’t find this support within your typical debugger, yet being able to get a trace of what’s going on within your CPU. is an important part of fault diagnosis.
Creating a trace file on a fault is actually my only method of debugging the CPU when dealing with an interrupt context, simply because it can be so difficult to predict when an interrupt takes place, or to stop and examine the CPU on that interrupt along the way.
Your debugging support will need at least one more item of support, and that item isn’t really a debugging operation. Specifically, you’ll want some way of reading the source code your CPU is running as you debug your program. Currently, the ZipCPU has disassembly support and not source level support. The reason is simply this: it’s easier to build an assembly level debugger than it is to build a source level debugger.
These are the things I’ve found useful when trying to debug the ZipCPU.
Keep in mind, this is by no means a comprehensive list of all the tools you might want or need to debug your CPU. However, you might find it to be a sufficient list to get you started–particularly because certain items on this list will require hardware support, and you may want to think about this support early in your CPU. design phase.
Debugging Contexts
From my own experience, I have found that there are three separate contexts for debugging a computer program on a CPU. The ZipCPU supports two of these contexts, and I have plans to support the third.
These are listed below:
-
Simulator: The first context you will want to debug your CPU within is within a simulator. Sure, the simulator isn’t nearly as fast as the FPGA, but within a simulator your debugger should be able to access the values of every internal variable within your design.
Fig 1: Debugging ZipCPU under Verilator 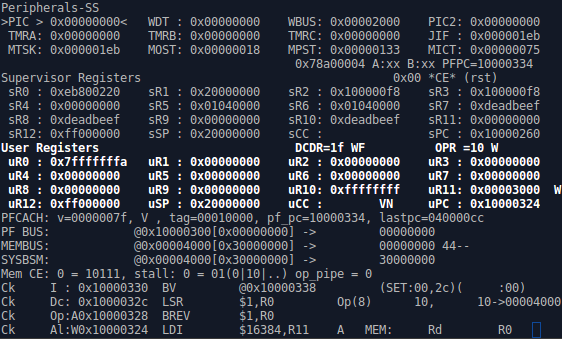
The problem I struggled with is that there are only so many characters on the screen. As a result, some of the items on the screen tend to be somewhat cryptic. For example, consider the “PFCACH: v=0000007f” item below the user registers. This tells me that the seven lowest number instruction cache lines are valid. Cryptic, right?
Still, even through this view is somewhat cryptic, each item on the screen was useful to me (at some time) to learn and know what was going on within the CPU. In particular, these many items were really easy to add to the screen when I needed them.
In spite of the cryptic information within the screen, you can still see all of the ZipCPU registers: sR0 throught sPC, and uR0 through uPC. You can also see the instructions each of the various stages are working on, as well as the fact that each stage is being clocked (Ck on the left).
-
Hardware: Once you place your CPU initially onto a piece of hardware, you’ll want access to the CPU to debug it. This means that you want to be able to support all of your typical debugging actions, enumerated in the last section, yet you’ll want to be able to invoke those operations from an external computer connected to your soft-core CPU.
Remember the debugging bus we put together? I use a similar debugging bus to debug the ZipCPU.
Of course, some things of necessity will change when you debug things in hardware. Two examples will prove this point: First, you are not likely to have access to every wire within your design when you wish to examine your CPU state. For this reason, the ZipCPU debugger, zipdbg, provides access to all 32-registers within the ZipCPU, but not all that much more. Second, your peripherals may not take well to stepping them by individual clock ticks. Hence memory interactions may need to be stepped through, one interaction at a time. For the ZipCPU, this has meant that the CPU can only step by single instructions, rather than by individual clock ticks, when debugging the CPU within the hardware.
Fig 2: Debugging ZipCPU on the Arty 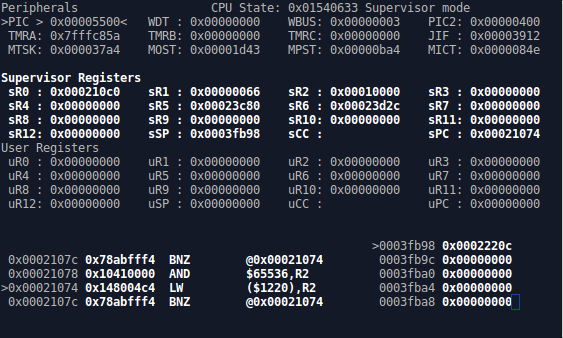
-
Software: What I mean by the Software context is that of a debugger, such as gdb, running natively from software within your CPU and applied to debugging another process running on your CPU.
While this might take some work to build, it’s worth considering when you design your processor whether or not you want your processor to eventually support this type of capability.
One thing that will throw a thorn in all of these context’s, though, is that you may struggle to know what is happening on or within your CPU when it responds to an interrupt. Sure, there’s a way to deal with this, but interrupts can make debugging via either hardware or software less than truly realistic. This is where the capability of creating a full-speed trace becomes important.
All together
To wrap this up, Figure 3 (below) places these ideas in a conceptual graphic, to help draw this discussion to memory. Notice that all of the operations we’ve discussed are shown on the left, and the three separate contexts are shown across the top.
 |
One thing the chart doesn’t show is that the columns (contexts) aren’t totally independent. Before you leave your simulator debugging context, you’ll want to make sure that you have proven that your hardware debugging interface works within the simulator. Likewise, before you move from the hardware debugging context to work on software debugging, you’ll want to double check, via either the hardware or simulator contexts, that the support you’ve placed within your CPU for software debugging actually works.
Perhaps I should mention that this is not my first attempt at putting this post together. On my first attempt, I tried to describe how to perform every one of the operations in every one of the contexts shown in Fig 3. The result was too much information for a single post. For now, just realize that there’s a different story behind each box on the chart, each choice of context and operation.
The entrance of thy words giveth light; it giveth understanding unto the simplle. (Ps 119:130)